Record Solar Power Generation in Australia as Gas Production Declines
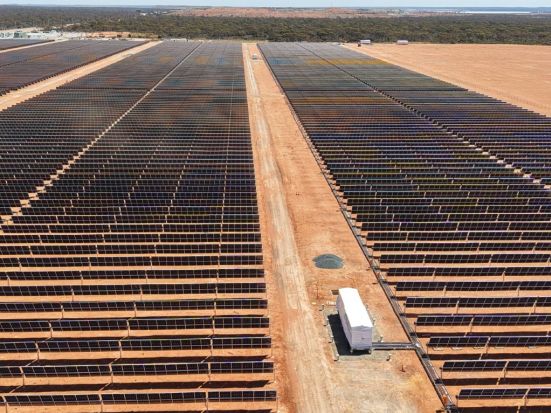
According to newly released data, large-scale solar energy generation achieved unprecedented levels in three Australian states during September. This uptick coincides with a minor year-on-year decrease in the curtailment of utility-scale photovoltaic (PV) systems, alongside a noteworthy drop in gas generation for the month.
Rystad Energy’s recent report on the Australian energy sector reveals that by the end of September 2026, combined output from utility-scale PV and wind energy sources climbed to 5.44 terawatt-hours (TWh), reflecting a 7 per cent increase from 5.1 TWh recorded in September 2025.
High Solar Output in Key States
September saw remarkable solar generation figures in New South Wales, Queensland, and Victoria, with New South Wales leading at 841 gigawatt-hours (GWh), followed by Queensland at 645 GWh, and Victoria contributing 267 GWh. The strong performance of solar facilities, particularly in NSW and Queensland, significantly boosted these totals.
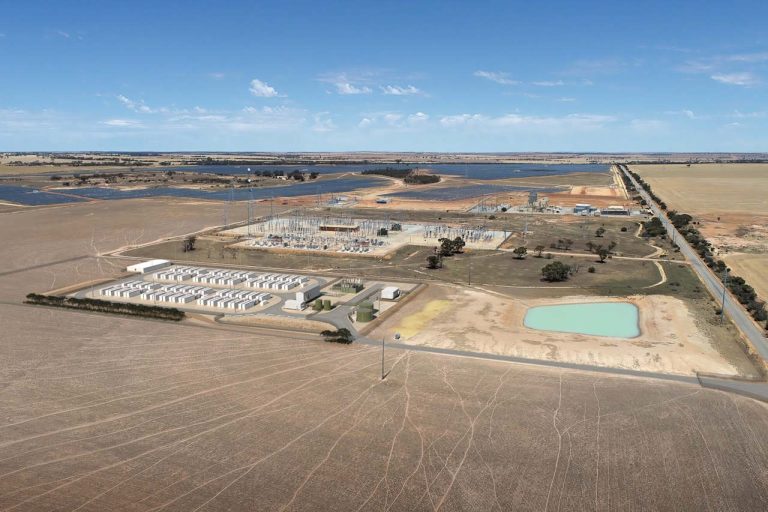
Among the standout solar assets for the month, New South Wales proudly housed the top two performers: Acen Australia’s recently finished Stubbo solar farm stages 1 and 2, which achieved a notable capacity factor of 35 per cent. With a total capacity of 400 megawatts (MW), Stubbo ranks among the largest solar farms in the country, situated about 10 kilometres north of Gulgong in the central west region of New South Wales. Plans are also underway for a possible 200 MW, 800 megawatt-hour (MWh) battery addition at the site.
Queensland Solar Farms Shine
In September, the third and fourth highest performing solar farms were located in Queensland. The Columboola facility, established by Hana Financial Investment, and the Edenvale farm, managed by Eneos Group and Sojitz Corporation, each achieved a 35% capacity factor.
When examining generation across the states, Victoria emerged as the leader in large-scale solar and wind output, with a total generation of 1.52 TWh consisting of 0.27 TWh from utility PV and 1.25 TWh derived from wind energy sources.
Trends in Energy Generation and Curtailment
David Dixon, a senior analyst at Rystad Energy, reported that while September 2026 did see high curtailment levels for both solar and wind, the amount of utility-scale PV curtailment is gradually decreasing, from 26 per cent in September last year to 22 per cent this year. As Dixon remarks, this trend indicates some progress in the management and utilisation of solar energy.
Furthermore, he highlighted a significant decline in gas generation across the National Electricity Market (NEM), which totalled only 455 GWh for September, marking a historic moment where gas output dipped below 500 GWh for that month. Meanwhile, wind generation across all states experienced a stagnant month, with the exception of Queensland, showing a drop of approximately 86 GWh compared to September 2025, as noted by Dixon on LinkedIn.
For the latest insights and news on clean energy, more than 29,000 subscribers receive daily updates conveniently in their inboxes as part of a free newsletter service.