Batteries Halve Solar Curtailment as PV Output Reaches Record High
Recent data has revealed a notable decrease in large-scale solar curtailment during August, bolstered by an increasing number of both large and small battery systems, alongside a relatively lower output from wind resources. This development is particularly significant given that solar production hit record highs for the month.
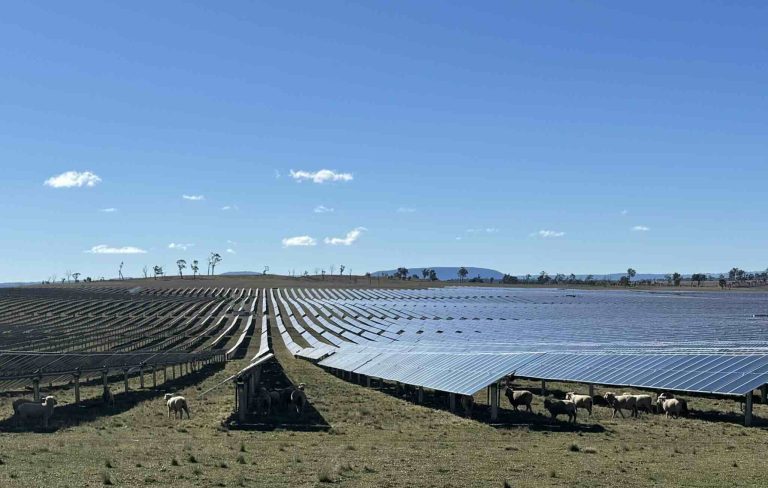
According to the latest monthly report from Rystad Energy, lead analyst David Dixon noted that curtailed output from utility-scale photovoltaic (PV) systems was recorded at 168 gigawatt-hours (GWh) in August 2026, which accounts for approximately 9% of available generation. This marks a decrease from the 284 GWh (approximately 18% of available generation) reported during August 2025.
Record Solar Generation
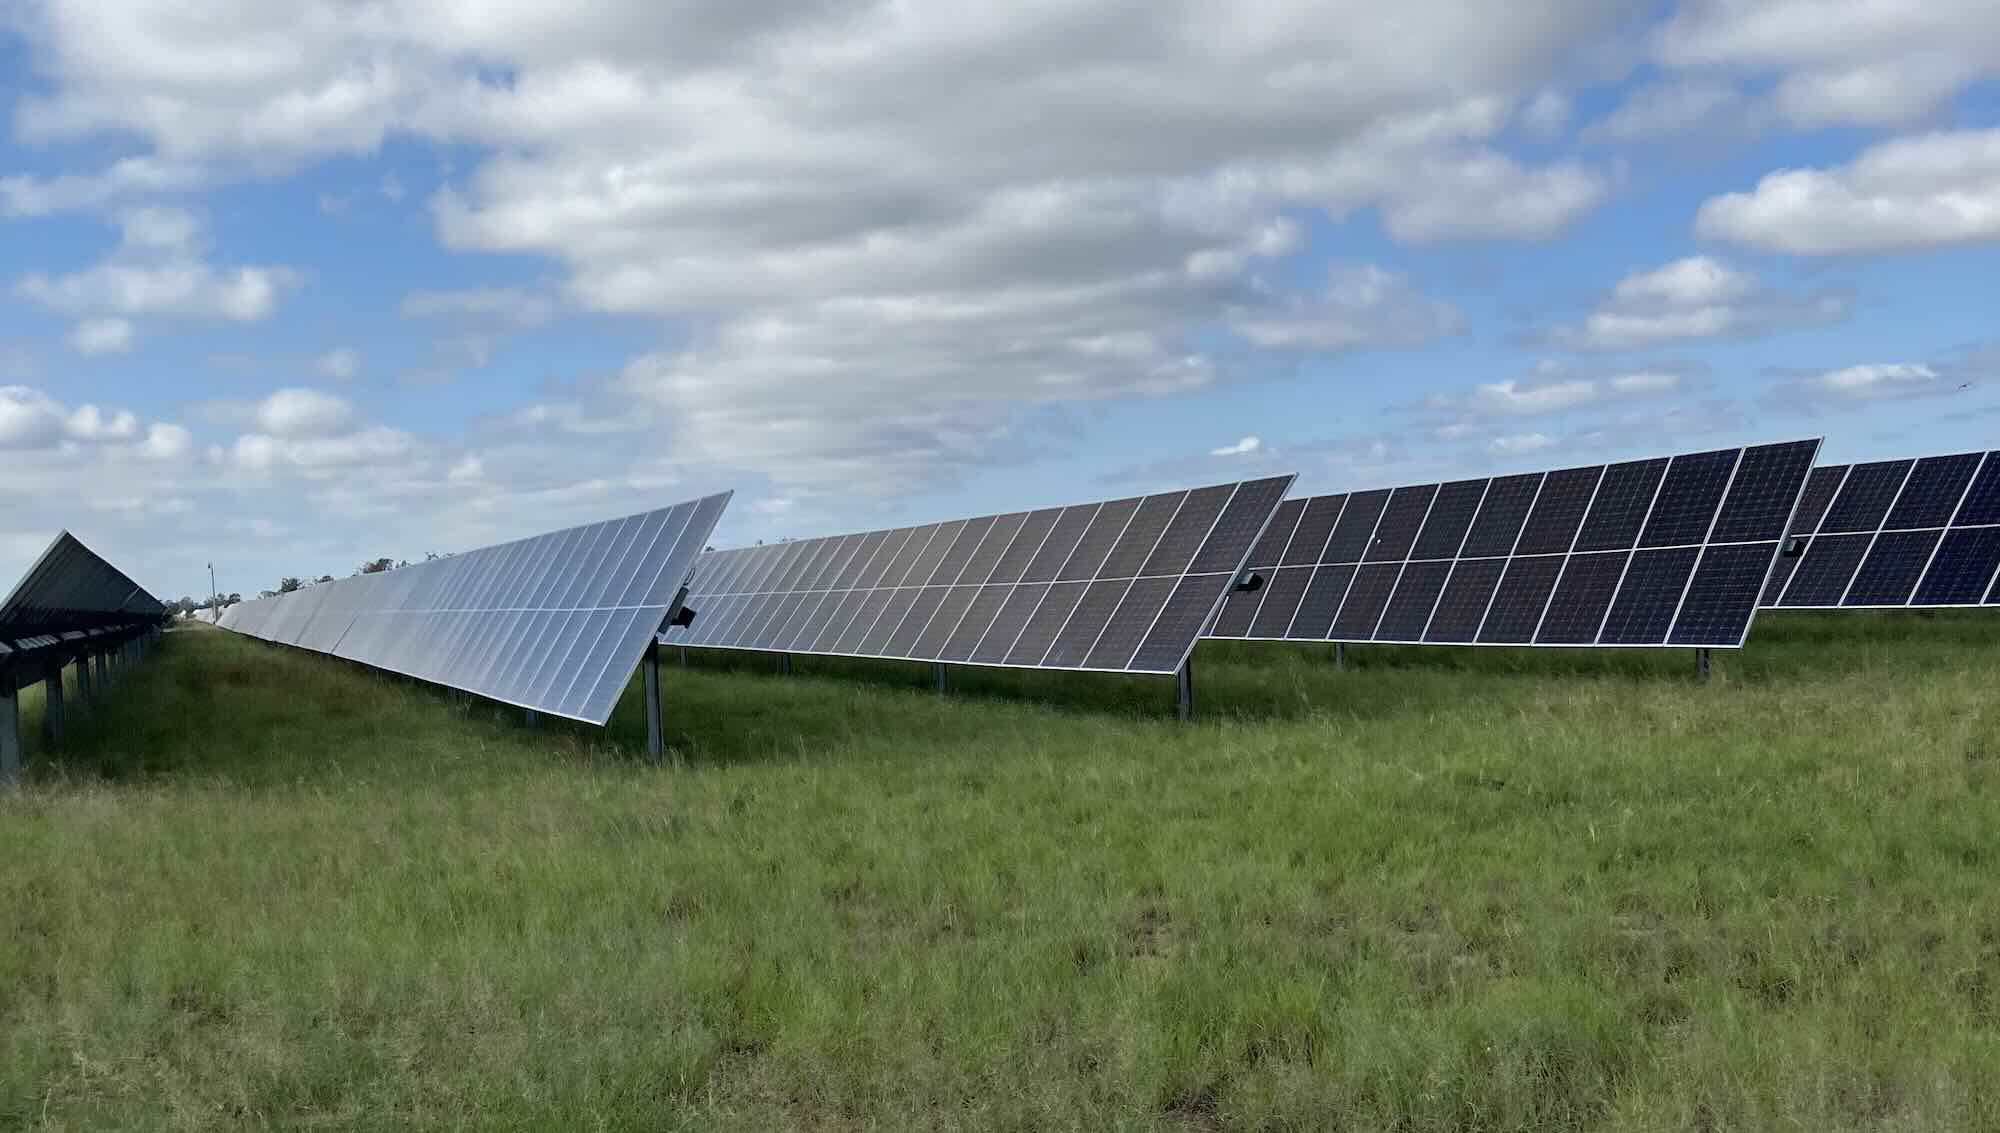
This drop in curtailment is commendable, especially as large-scale solar generation reached unprecedented levels in August across three key states in the National Electricity Market (NEM). New South Wales saw output of 684 GWh, Queensland contributed 665 GWh, and Victoria generated 213 GWh.
Dixon also highlighted a contrasting trend for wind generation, which experienced a decline. He mentioned in a LinkedIn report that wind output in August 2026 fell in all states except Queensland, with a reduction of approximately 205 GWh compared to the same month in the previous year.
Overall Generation and Electricity Prices
Collectively, Australia’s utility-scale solar and wind installations produced 4.99 terawatt-hours (TWh) in August, reflecting a 3% increase from the 4.86 TWh generated in August 2025. Additionally, wholesale electricity prices across all NEM states decreased year-on-year, with prices remaining below $A80 per megawatt-hour (MWh).
Among the standout large-scale solar installations in August were those in Queensland. The Pacific Blue-owned Haughton solar farm (stage 1), with a capacity of 100 megawatts (MW), achieved a capacity factor of 28%. Similarly, the 204 MW Edenvale Solar Park in Queensland’s Western Downs region recorded an equal capacity factor, along with Genex Power’s Kidston solar farm.
Top Wind Performance
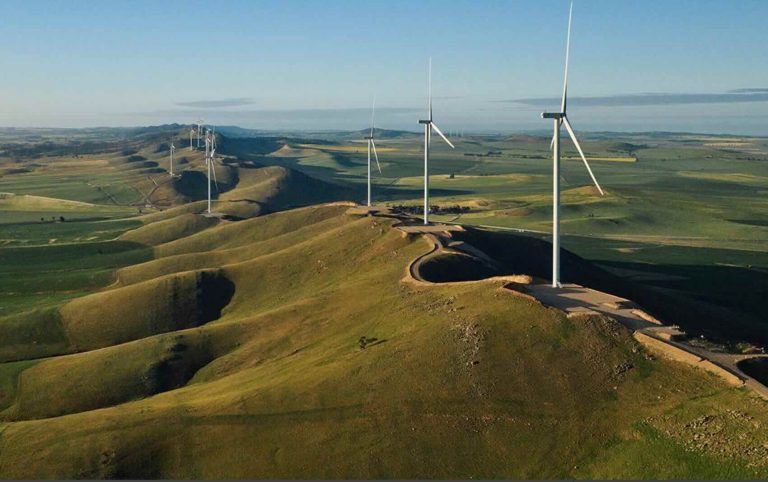
In terms of wind, top-performing assets were more varied geographically. Notably, Potentia Energy’s Flat Rocks wind farm in Western Australia excelled with a capacity factor of 51%. Meanwhile, RATCH Australia’s Mount Emerald wind farm in Queensland achieved a 40% capacity factor, and Woolnorth Renewables’s Musselroe wind farm in Tasmania capped at 39%.
On a state level, Victoria emerged as the leader with utility PV generating 213 GWh and wind contributing 1,174 GWh, resulting in a remarkable combined total of 1,387 GWh.
To stay informed with the latest developments in clean energy, you can join over 29,000 subscribers by signing up for our free daily newsletter.