Solar Revenues Reach Two-Year High as Gas Generation Declines
October 2026 has been a standout month for large-scale solar energy production across Australia’s National Electricity Market (NEM), marking an impressive increase in earnings for asset owners and investors following record energy generation highs in September.
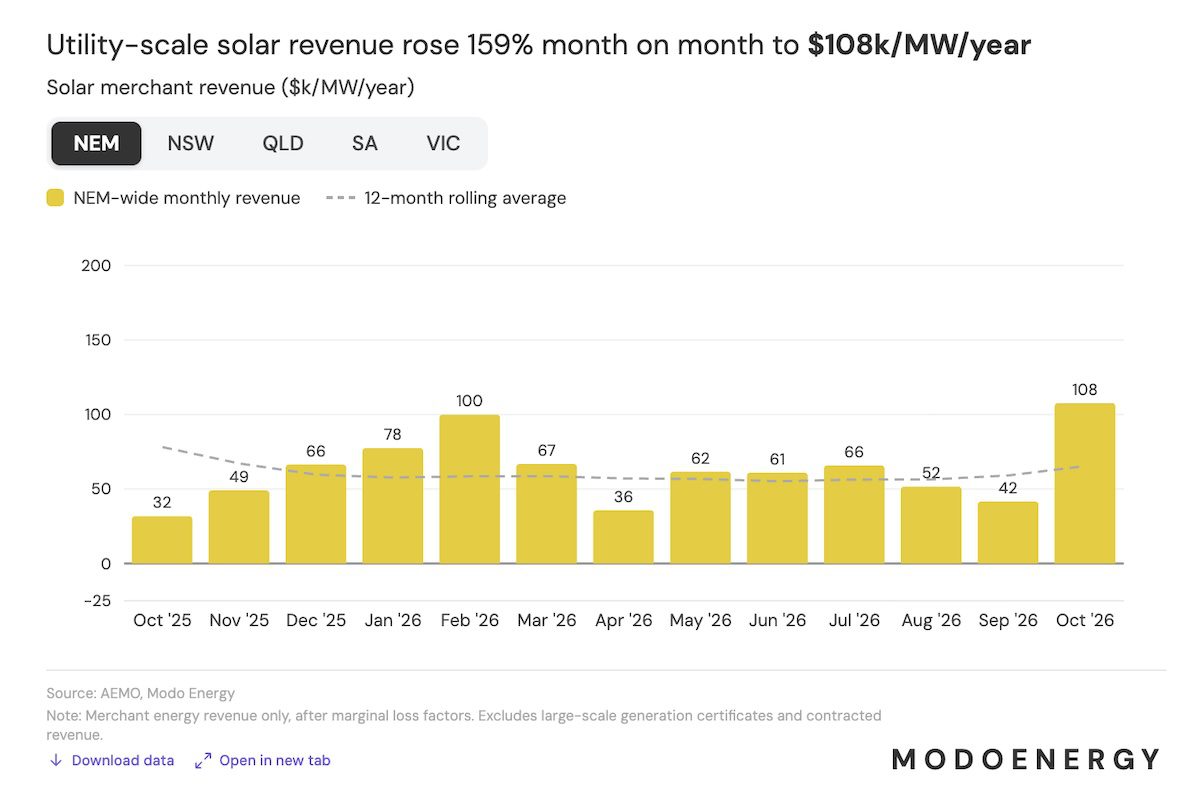
Modo Energy’s latest report reveals that merchant utility-scale solar revenues for the spring’s second month reached an impressive $A107.7k per megawatt (MW) annually, reflecting a staggering 159 per cent rise since September and the highest levels observed since December 2024.
Understanding Merchant Revenues
These figures specifically account for revenues earned through direct sales into the wholesale spot market, independent of contractual agreements. While many solar generators in the NEM typically operate under some form of contract, including Power Purchase Agreements (PPAs), the recent downturn in merchant revenue due to negative daytime pricing and large-scale solar reductions driven by extensive rooftop solar and wind competition has made such agreements notably popular.
Factors Influencing Revenues
October’s results were supported by an increase in battery storage, coupled with reduced wind generation and a rise in operational demand, aided by higher bids from coal and gas plants. Modo Energy power market analyst Frances Hallen expressed her enthusiasm for the month’s performance on LinkedIn, stating, “October merchant solar revenues were the highest since December 2024, and 2.6 times higher than in September.”
Hallen elaborated that all states experienced revenue increases, with New South Wales and Queensland reporting the most significant gains. She noted that heightened midday cooling demand alongside diminished wind and solar output exacerbated supply constraints, leading to higher solar capture prices across the board.
Regional Highlights
In particular, Queensland benefitted immensely from this resurgence, with merchant project revenues soaring by 166 per cent compared to the previous month. The Modo report highlights a midday demand surge of 1.3 GW coinciding with a 9 per cent drop in rooftop solar generation, ultimately boosting Queensland’s capture rate by 21.2 percentage points—the largest increase among all states.
However, it wasn’t all rosy, as Hallen pointed out that battery revenues declined concurrently, as the costs associated with charging rose. In a grid saturated with solar and storage, these two energy sources are seen as partly providing stability to one another.
Trends in Energy Generation
According to Rystad Energy senior analyst David Dixon, the frequency of negative pricing hours along with curtailed utility-scale solar and wind generation have started to show signs of diminishing over the past year, attributed to the increased deployment of large battery capacities. “This trend is anticipated to persist in the near future as the battery fleet within the NEM is projected to expand from 26 GWh to nearly 60 GWh by the end of 2028, based solely on projects that have secured financing or are already in the construction phase,” Dixon explained.
Meanwhile, it’s worth noting that gas generation figures remained relatively average, totalling just 426 GWh—marking the lowest output for October since NEM’s inception.
For those interested in staying updated with the latest clean energy news, over 29,000 subscribers receive daily updates straight to their inbox for free. Supporting independent media is crucial in challenging misinformation concerning the energy transition.