Western Australia Surpasses National Grid in Renewable Energy Transition
In a surprising turn of events, Western Australia (W.A.) has emerged as a frontrunner in the shift towards renewable energy, surpassing all other states in the nation. The South West Interconnected System (SWIS) has achieved a remarkable renewable energy share of 50.7 per cent over the last three months, outdoing the National Electricity Market (NEM) which stands at 49.9 per cent.
In December, W.A. reached an impressive 53.9 per cent renewable share in its primary grid, according to Rystad Energy. This figure beat the NEM’s 50.4 per cent, marking significant monthly milestones for both systems.
Remarkably Isolated Yet Successful
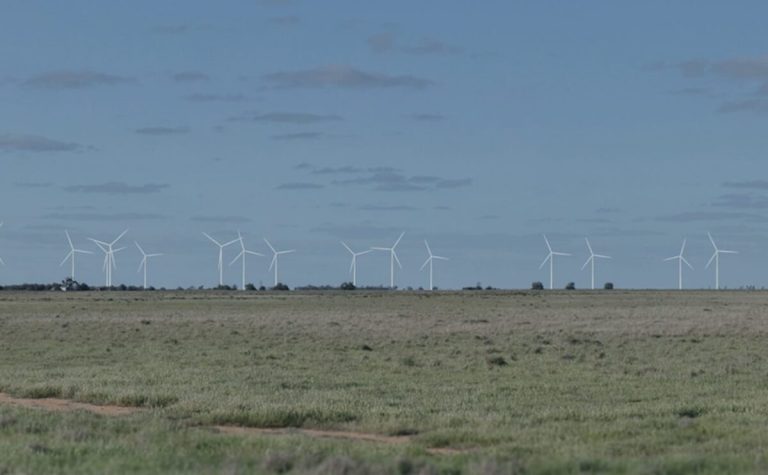
What makes W.A.’s accomplishment even more striking is its status as an isolated grid, with no means to import or export power to and from other states or countries. This reality means that its capacity to generate renewable energy relies solely on wind and solar, with storage being powered entirely by batteries, both on household and a larger scale.
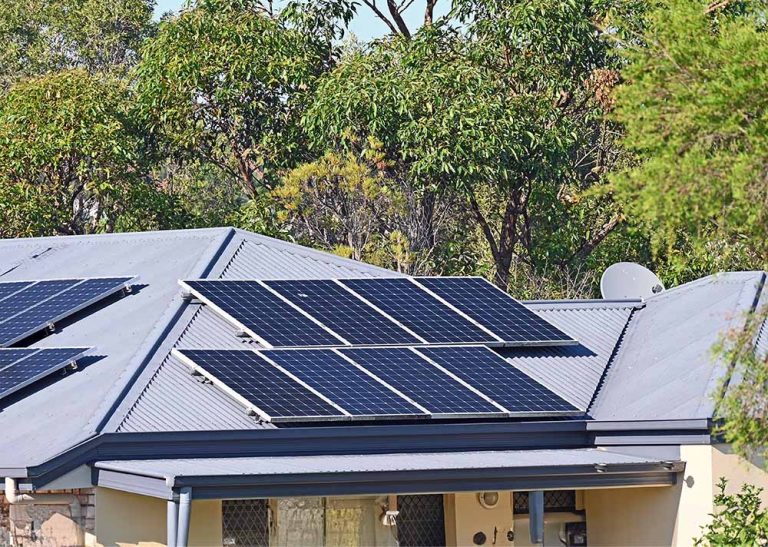
Not long ago, W.A. was wrestling with the implications of the “solar duck curve,” a phenomenon resulting from the rapid increase of solar rooftops in Perth and surrounding areas. Due to its isolated grid structure, unlike interconnected regions such as South Australia, W.A. cannot allow solar energy output to meet local demand fully. In stark contrast, South Australia managed to reach this milestone for two consecutive days during the Christmas period, a feat not achievable in W.A.
Advancements in Battery Storage
In a bid to manage this duck curve effectively, W.A. has accelerated the deployment of large-scale battery storage solutions, housing two of the country’s largest batteries. Located in Collie, a coal-centric region, these impressive batteries each possess storage capacities exceeding 2 gigawatt hours.
Jai Thomas from Energy Policy W.A. likens the state’s renewable journey over the past decade to a crocodile’s head, where renewables are now outpacing coal and gas, with the remaining coal-fired power plants projected to cease operations by the decade’s end. As Thomas shared on LinkedIn, ongoing investments and renewable energy projects indicate continuous growth and notable advancements in the energy transition.
Record-Setting Performance
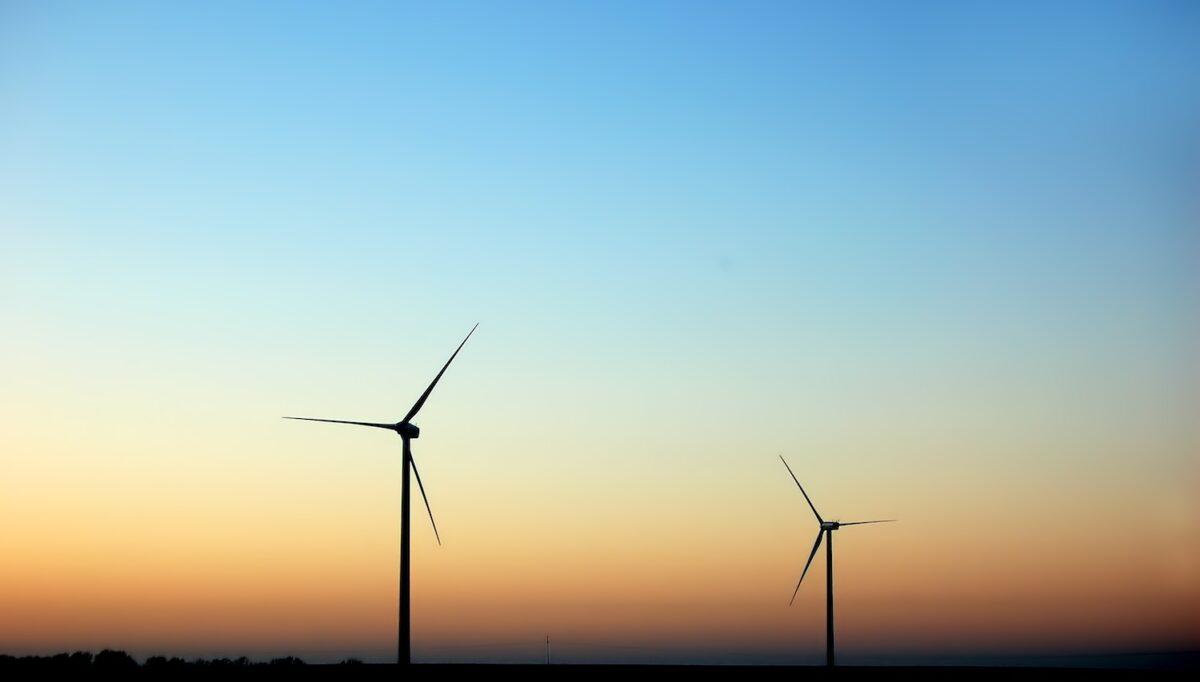
These substantial battery installations have significantly curtailed potential energy wastage, with W.A.’s wind and solar farms frequently ranking among the best performers nationwide. Rystad Energy’s David Dixon reports that W.A. boasts the top three wind farms in the country for December, with Badgingarra leading at a remarkable average capacity factor of 60 per cent, outperforming many coal plants in the NEM. Yandin and Warradarge followed closely with 59.9 per cent and 56.4 per cent, respectively.
Additionally, the highest-performing solar farm in December was Merredin in W.A., achieving a capacity factor of 45.2 per cent. Two facilities in New South Wales, Griffith and Moree, ranked next with capacity factors of 40.1 per cent and 39.7 per cent, respectively. Notably, NSW had 11 out of the 20 best-performing solar facilities this month and became the first state to generate more than 1 terawatt hour from utility-scale solar in a single month, achieving 1.05 TWh from utility PV alongside 626 gigawatt hours from wind energy.
Trends in Generation and Curtailment
During December, total renewable generation in the NEM reached 9.5 TWh, with curtailment levels standing at 6.3 per cent. Dixon reported that this month marked one of the lowest for coal generation since 2011, as well as the fourth-lowest for gas generation, a trend likely to continue with the increasing integration of household and grid-scale batteries.
Remarkably, battery output surged more than threefold over the past year in both the NEM and SWIS, with NEM batteries discharging 248 GWh in December—up from 68 GWh in 2024. In W.A., large batteries contributed to a discharge of 102 GWh, increasing from 32 GWh in the previous December.
According to Dixon, December also saw a record number of hours experiencing negative prices across all NEM states, apart from Tasmania. South Australia recorded 351 hours with negative prices, constituting 47 per cent of the month, while Victoria had 290 hours (39 per cent), Queensland 189 hours (25 per cent), and New South Wales 159 hours (21 per cent).