Western Australia Surpasses National Grid in Renewable Energy Transition
A surprising statistic has emerged; Western Australia (W.A.), renowned for housing the world’s largest isolated power grid, is surpassing the rest of Australia in the shift towards renewable energy. In the past three months, W.A.’s South West Interconnected System has achieved a renewable energy share of 50.7%, comfortably outpacing the National Electricity Market (NEM), which recorded a 49.9% share.
December alone saw W.A. hit an impressive 53.9% renewable contribution to its main grid, in contrast to the NEM’s 50.4%. Both figures are significant monthly milestones.
Unique Challenges of an Isolated Grid
W.A.’s achievement is particularly noteworthy given the isolated nature of its grid, which lacks transmission links to other states or countries for power import or export when required. Additionally, it does not utilise pumped hydro or any hydroelectric power, relying solely on wind and solar for its renewable energy supply and on batteries—both domestic and grid-scale—for storage.
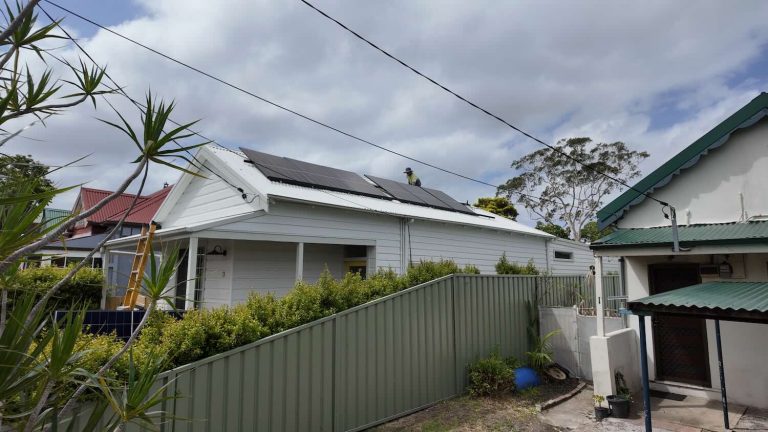
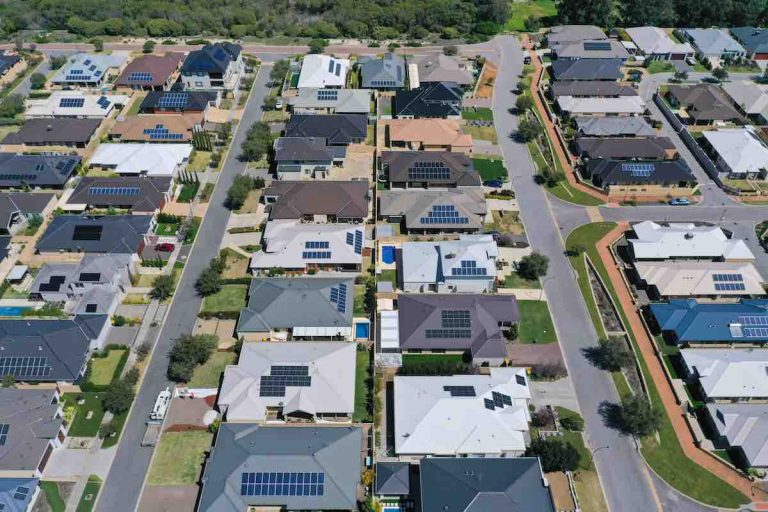
Previously, concerns were raised in W.A. regarding the solar ‘duck curve’—the challenge posed during midday when rooftop solar energy usage peaked due to widespread installations in Perth and surrounding areas. Unlike South Australia, which celebrated a 100% rooftop solar output relative to local demand over two consecutive days during Christmas, W.A. cannot achieve this due to its grid’s isolation.
Investment in Battery Storage
To tackle the solar duck curve, W.A. has rapidly implemented large-scale battery storage systems, including Australia’s two largest operational batteries situated in Collie, both offering over 2 gigawatt hours of storage capacity. Jai Thomas, co-ordinator of Energy Policy W.A., likens the region’s progress over the last decade to a crocodile’s head, noting an upward trend where renewables are now surpassing coal and gas, with projections indicating the closure of the remaining coal-fired plants by the decade’s end.
According to Thomas, “With transmission investments underway and renewable projects being built, this trend will only continue to grow; there’s still work to be done, but we are making significant strides in the energy transition,” as he shared on LinkedIn.
Outstanding Performance of Renewable Projects
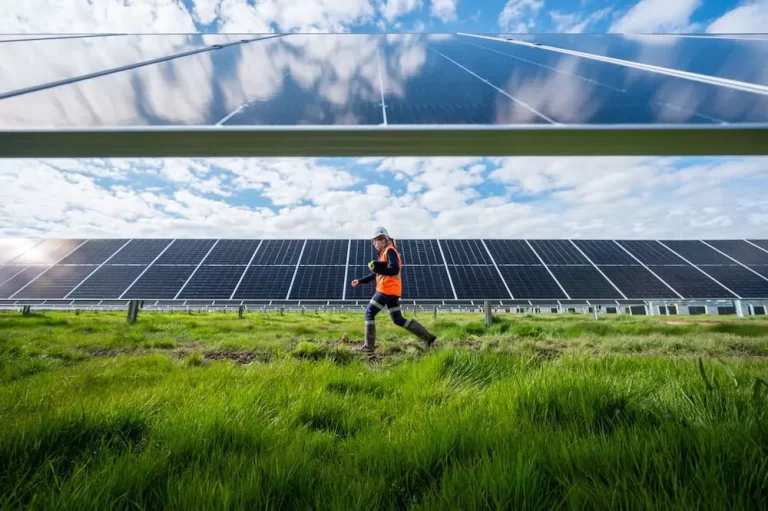
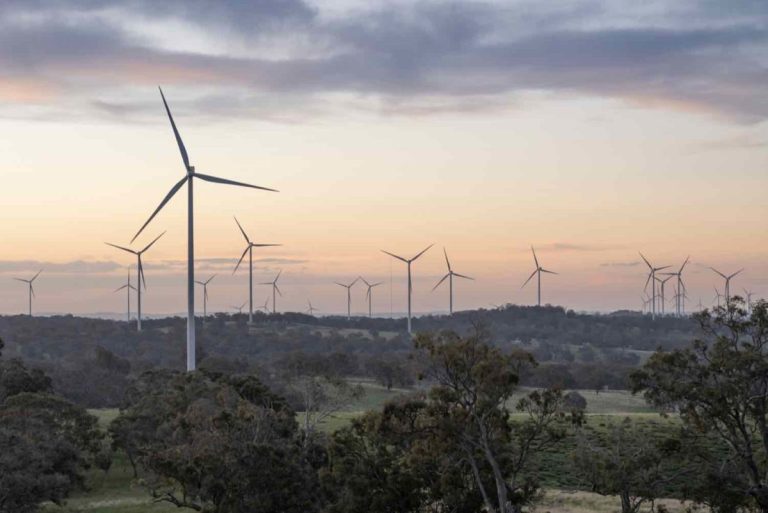
W.A.’s large batteries have been instrumental in minimising potential energy curtailment, leading to the state’s wind and solar farms emerging as frontrunners nationwide in terms of performance. David Dixon from Rystad Energy, who publishes a monthly report detailing the top-performing wind and solar projects, notes that three of the best wind farms in December were based in W.A. The Badgingarra wind farm surpassed others with an average capacity factor of 60%, outperforming many coal power stations in the NEM, closely followed by Yandin and Warradarge with 59.9% and 56.4% respectively. Additionally, both Collgar and Emu Downs wind farms secured fourth and fifth positions.
The highest performing solar farm for December was the Merredin facility in W.A., boasting a capacity factor of 45.2%, while the next best performers were in New South Wales—Griffith and Moree—with factors of 40.1% and 39.7% respectively.
NSW’s Solar Milestone
According to Dixon’s analysis, December saw New South Wales host 11 of the top 20 performing solar installations in the nation, achieving a remarkable first by generating over 1 terawatt hour (TWh) from utility-scale solar in a single month, specifically 1.05 TWh, in addition to 626 gigawatt hours (GWh) from wind. The total renewable generation across the NEM reached 9.5 TWh during the month, with curtailment levels recorded at 6.3%, as per Open Electricity.
Dixon pointed out that December marked a significant decline in coal generation since early 2011 and was noted for being the fourth lowest month for gas output. This trend aligns with the increased adoption of household and grid-scale battery systems.
Record Levels of Battery Discharge
Battery capacities have tripled in both the NEM and W.A.’s South West Interconnected System over the past year, with NEM batteries discharging 248 GWh in December 2025, a considerable rise from 68 GWh in the previous year. Meanwhile, large batteries in W.A. discharged 102 GWh, an increase from 32 GWh in December 2024.
Dixon also mentioned that December set a new record for the number of hours of negative pricing across all NEM states, with South Australia experiencing negative prices for 351 hours—47% of the month—followed by Victoria at 290 hours, Queensland at 189 hours, and New South Wales at 159 hours.