Western Australia Surpasses National Grid in Renewable Energy Transition
In a surprising turn of events, Western Australia (W.A.), home to the world’s largest isolated electricity grid, is currently surpassing the rest of the nation in its shift towards renewable energy sources. Over the past three months, the South West Interconnected System in W.A. has achieved a remarkable renewable share of 50.7%, compared to 49.9% in the National Electricity Market (NEM), Australia’s primary grid.
In December alone, W.A.’s renewables share reached an impressive 53.9%, while the NEM recorded a share of 50.4%, both setting new monthly records. This achievement is even more noteworthy given the isolation of W.A.’s grid, which lacks connections to other states or countries, limiting its ability to import or export power as necessary.
Reliance on Wind and Solar Energy
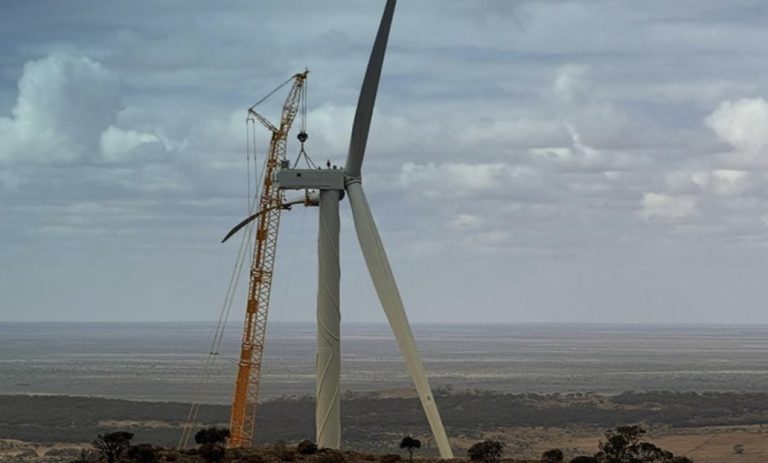
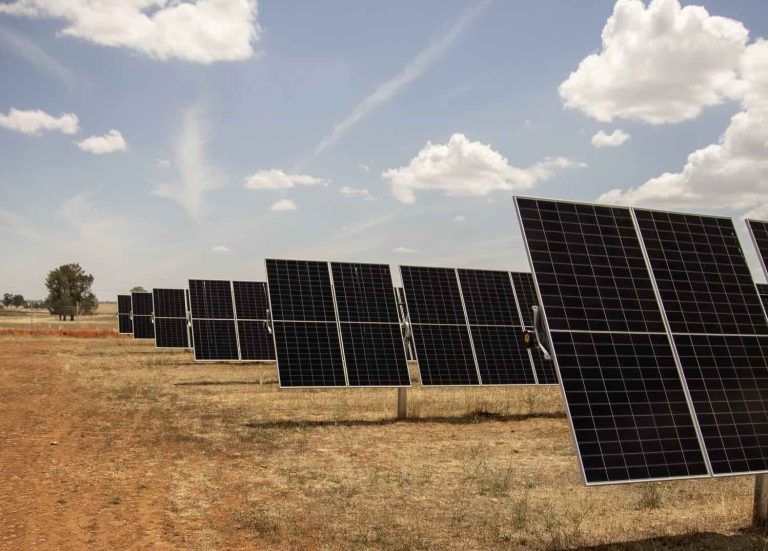
With no pumped hydro or any form of hydroelectricity, W.A.’s renewable energy contribution stems entirely from wind and solar power. Its energy storage relies solely on battery systems, including those at both household and grid scales. Until recently, W.A. faced challenges related to solar energy, particularly the so-called solar duck curve brought about by a significant uptake of rooftop photovoltaic (PV) systems in key areas such as Perth and its regional towns.
Unlike interconnected grids such as South Australia, W.A. is unable to permit rooftop solar output to fulfil 100% of local demand. South Australia achieved this milestone during two consecutive days over the Christmas period, highlighting the limitations of W.A.’s isolated system.
Investment in Battery Storage Solutions
To address the solar duck curve issues, W.A. has accelerated its investment in large-scale battery storage. It is noteworthy that the two largest batteries by current operational capacity in Australia are both located in Collie, a coal-producing region, with capacities exceeding 2 gigawatt hours each. Jai Thomas, coordinator at Energy Policy W.A., likens the state’s recent evolution to a crocodile’s head, illustrating how renewables are now outstripping conventional coal and gas power sources, with the remaining coal-fired plants expected to cease operations by the decade’s end.
Thomas shared insights on LinkedIn, noting that as transmission investments progress and additional renewable energy projects are underway, these developments will foster further growth in W.A.’s energy transition.
Performance of Renewable Energy Infrastructure
Thanks to the influence of substantial battery installations, W.A. has seen a decrease in potential power curtailment. Consequently, the state’s renewable energy facilities consistently rank among the best performers in the nation. Rystad Energy’s David Dixon noted that during December, the top three wind farms in Australia were all located in W.A., with the Badgingarra wind farm leading the nation with an average capacity factor of 60%, surpassing many coal-fired stations within the NEM.
Following closely were the Yandin and Warradarge wind farms at 59.9% and 56.4%, respectively. Additionally, the Merredin solar farm also topped the charts for solar performance in December, achieving a capacity factor of 45.2%. This was followed by two solar facilities in New South Wales, which recorded slightly lower capacity factors.
New South Wales Surpasses Milestones
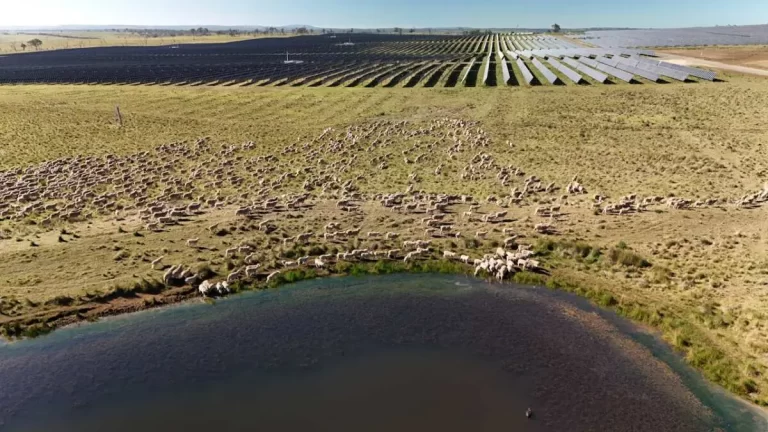
According to Dixon’s findings, during December, New South Wales boasted 11 out of the 20 highest-performing solar farms across the country and made history by becoming the first state to generate over 1 terawatt hour (TWh) from utility-scale solar in a single month. The state totalled 1.05 TWh from utility PV in December, along with an additional 626 gigawatt hours (GWh) coming from wind energy. Overall, the NEM’s renewable generation for the month reached 9.5 TWh, with curtailment levels recorded at 6.3%.
Shifting Trends in Energy Generation
Dixon also pointed out that December marked the eighth lowest month for coal generation since 2011, as well as the fourth lowest for gas generation. This decline is anticipated to persist along with the upsurge in both household and grid-scale battery installations. In fact, the capacity of grid scale batteries rose by over threefold in the previous year within both the NEM and the South West Interconnected System, with batteries discharging 248 GWh in December 2025 compared to only 68 GWh in December 2024. Notably, W.A.’s main grid batteries discharged 102 GWh, significantly up from just 32 GWh the previous December.
December also set a record for the duration of negative pricing across all NEM states except Tasmania, with reports showing 351 hours of negative prices in South Australia, representing 47% of the month. Victoria and Queensland reported 290 hours and 189 hours of negative prices, respectively, while New South Wales saw 159 hours, accounting for 21% of the month.
For those interested in keeping pace with the latest developments in clean energy, subscriptions to a free daily newsletter are available, highlighting essential news in the sector.