Western Australia Surpasses National Grid in Renewable Energy Transition
A surprising statistic has emerged – Western Australia, home to the world’s largest isolated power grid, is now leading the nation in its shift towards renewable energy.
In recent months, W.A.’s South West Interconnected System has outperformed the National Electricity Market (NEM), achieving a renewable energy contribution of 50.7 per cent, compared to NEM’s 49.9 per cent.
Record Renewable Sharing
For December, W.A. reported an impressive 53.9 per cent of its grid powered by renewables, as per Rystad Energy, while NEM managed 50.4 per cent, marking a record for both systems for the month.
This notable achievement is particularly striking given W.A.’s geographical isolation, lacking any connections to other states or countries, which inhibits the ability to export or import electricity as necessary.
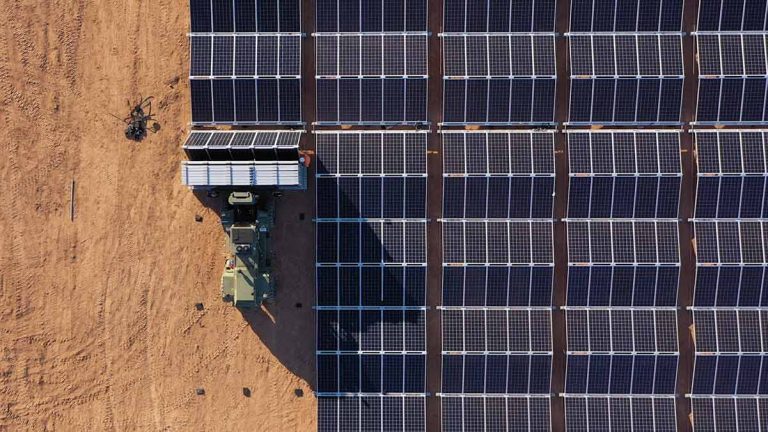
Reliance on Wind and Solar
Unlike other regions, W.A. does not utilise pumped hydroelectric systems – all of its renewable energy comes exclusively from wind and solar, with energy storage provided solely by batteries, both residential and large-scale.
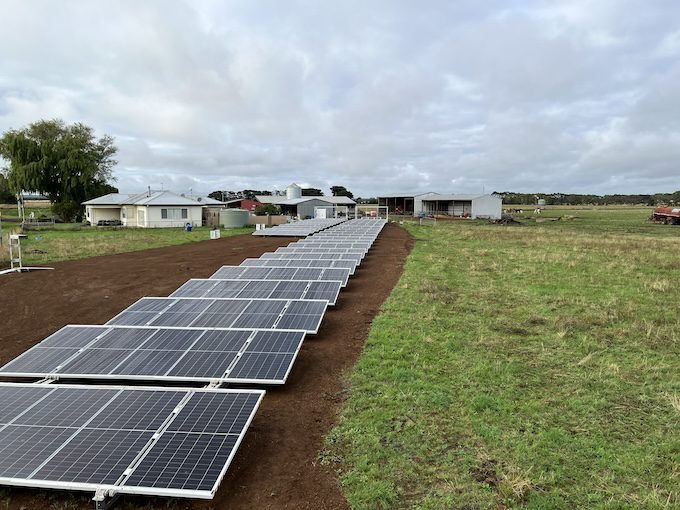
Previously, concerns focused on the ‘solar duck curve’ that appeared during midday hours, mainly due to the significant installation of rooftop photovoltaic systems in Perth and surrounding areas.
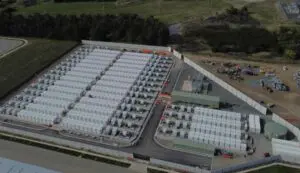
Storage Solutions and Future Prospects
W.A.’s isolated configuration means that, unlike South Australia, it cannot match rooftop solar output with local demand, a feat South Australia achieved on two consecutive days last Christmas. To combat the solar duck curve, W.A. is rapidly deploying large battery storage solutions, including Australia’s two largest batteries, located in Collie, with capacities surpassing 2 gigawatt hours each.
Jai Thomas, the energy coordinator for Energy Policy W.A., likens the state’s progress over the past decade to a crocodile’s head, where renewables have begun to surpass traditional coal and gas resources, with remaining coal plants expected to cease operations by the decade’s end.
Impact of Large Batteries
These substantial battery installations have managed to lower the potential for curtailment, leading W.A.’s wind and solar farms to frequently rank as the nation’s highest performers.
According to David Dixon from Rystad Energy, three of the top-performing wind farms in Australia for December were located in W.A. The Badgingarra wind farm achieved a remarkable average capacity factor of 60 per cent, outperforming many coal power stations in the NEM, with Yandin and Warradarge following closely at 59.9 per cent and 56.4 per cent respectively.
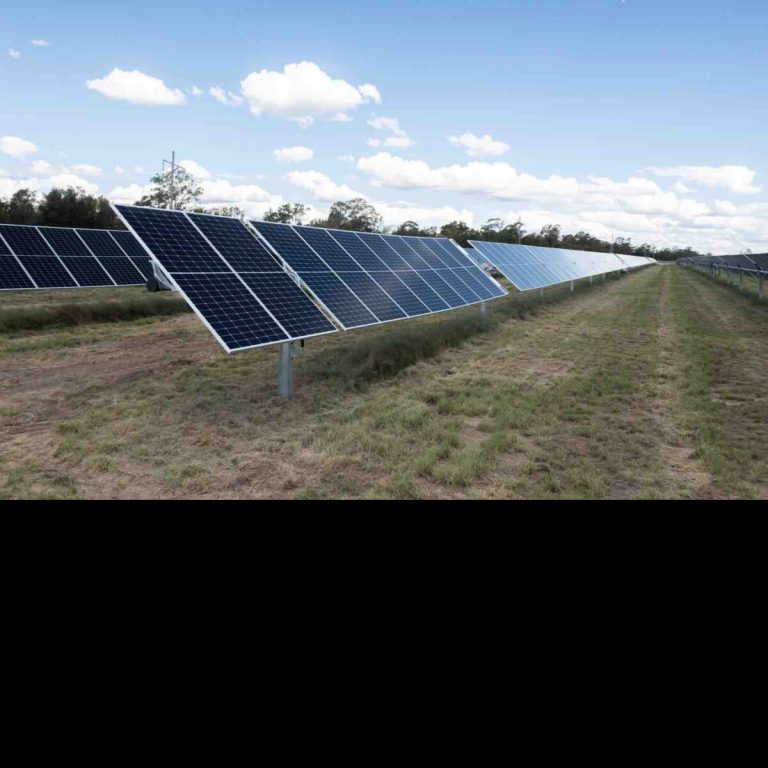
Leading Solar Performances
In the solar sector, W.A.’s Merredin facility excelled as the best-performing solar farm nationally, with a capacity factor of 45.2 per cent, closely succeeded by Griffith and Moree in NSW.
Dixon’s findings indicated that solar facilities in NSW dominated the rankings, capturing 11 out of the top 20 spots for December. Notably, NSW became the first state to surpass 1 terawatt hour (TWh) from utility-scale solar in a month, generating 1.05 TWh from this source and an additional 626 gigawatt hours (GWh) from wind.
A Shift in Energy Trends
In total, renewable generation across the NEM reached 9.5 TWh in December, with curtailment levels at 6.3 per cent according to Open Electricity records. December also marked the eighth lowest month for coal generation since early 2011 and the fourth lowest for gas generation, trends anticipated to persist with an increase in both household and grid-scale battery deployment.
Notably, large-scale battery usage in both the NEM and the SWIS surged by over threefold within the past year, with NEM batteries discharging 248 GWh in December 2025, up significantly from just 68 GWh the previous year. In W.A., big batteries released 102 GWh, an increase from 32 GWh in December 2024.
Negative Pricing Records
Dixon also mentioned that December set a monthly record for the frequency of negative pricing across all NEM states, with the total hours reaching 351 in South Australia, 290 in Victoria, 189 in Queensland, and 159 in New South Wales.